Search This Blog by Google

Search This Blog

Welcome to Dijemeric Visualizations

Where photography and mathematics intersect with some photography, some math, some math of photography, and an occasional tutorial.

Total Pageviews

Thursday, August 29, 2013

Using a Monte Carlo Program to Define Process Control Parameters


Using a Monte Carlo Program to Define Process Control Parameters
© Ken Osborn 2013


Abstract: Profiler is a program written in Excel® Visual Basic® and uses a Monte-Carlo simulation to fit process data to a Normal distribution. Output includes raw data and simulation statistics and outliers are identified and flagged. If the data are not skewed and show a good fit except for the outliers, process control limits can be calculated from the Normal curve average and standard deviation.

The Problem
Controlling any production process like weight of material added to a mix, treatment and discharge of a waste product, or analysis of a material requires that the variance be predictable. When a process exceeds the established variance it is out-of-control. Process control parameters include the process average, standard deviation, and control limits. Control limits are frequently set at the average plus or minus three standard deviations.

The difficulty with this approach is that if the statistics used to set the control limits are generated when the process is out-of-control they will overestimate the acceptable range of variance by including outliers that may not be initially suspect. This may be particularly true at process startup when there is no baseline of data.

The Solution
To avoid the problems of outliers driving the process control statistics, the control limit statistics can be derived from a Normal distribution fitted to the process data. The Normal distribution will exclude outliers and more closely reflect the variance in the process output when it is under control.

Profiler, a program written in Excel, fits a Normal curve to a data set using a Monte Carlo simulation. The fit is iterative starting with an initial guess which checks for fit against the 25th and 75th percentiles of the data. Adjustments are made to the mean and standard deviation of the simulation until a pre-set error is achieved based on the 75th percentile. The error is optimized for low error vs time for convergence. Output consists of 100 data points, simulation mean, standard deviation, 25th, 75th, and 99th percentiles, and flags all values in the original data set exceeding one standard deviation of the 99th percentile.

An Example
Data plotted in red in Chart 1 are from a waste discharge stream controlling for mercury. Clearly some of the values are outliers and do not represent the process when it is in control.
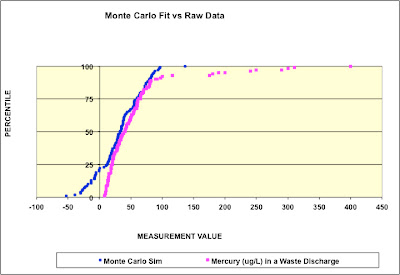

Chart 1: Mercury in discharge vs Monte Carlo simulation

The blue line represents the Monte Carlo fit to a Normal distribution. The majority of the mercury discharge data exhibit a close fit to the simulation curve with outliers clearly visible. The statistics for the mercury and simulation results (Table 1) show the divergence from normalcy at the extreme ends of the distribution. Of course, we are only concerned about the high outliers that would drive the statistics if retained. Using the raw data, a 3-sigma upper control limit (3S UCL) calculates as 240 while the simulation UCL is 141.

Since the raw data clearly include results from the process when it was out of control, outliers should be excluded. But which ones? Using the raw data 3S UCL leaves several high values that could misrepresent the process when in control. Conversely, using the simulation UCL may remove more values than justified. Using an alternative determination of 1 standard deviation above the 99%tile (UCL_PTile), the simulation UCL_PTile is 133. If the raw data 3S UCL is used, there are six outliers (240, 250, 290, 300,310, and 400). If the simulation UCL_PTile value is used, there are ten outliers (175, 180, 190, 200, 240, 250, 290, 300, 310, 400). These are the values plotted in red at the extreme right in Chart 1.
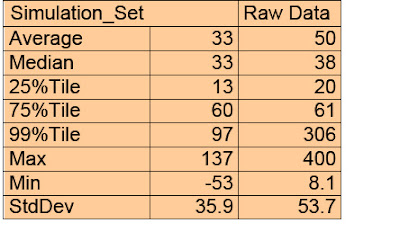

Table 1: Comparison of Monte Carlo and Raw Data Statistics

When the 3S UCL is recalculated for the raw data excluding the outliers exceeding the simulation UCL_Ptile, the statistics for the raw data are comparable to the simulation (Table 2). In addition, whether the 3S UCL or the UCL_PTile is used makes little difference. Once the outliers have been identified, the data represent a process that is predictable.
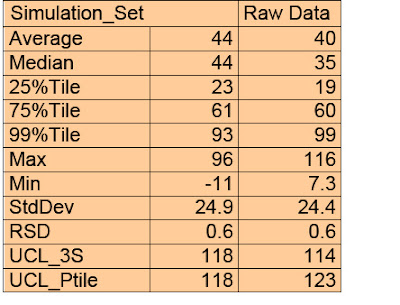


Table 2: Process statistics after removal of outliers

Conclusion

Statistical control of a process requires establishing realistic control limits based on data that represent the process in control. At startup the process may not be in control and include outliers. Fitting the data to a Normal curve from which the control statistics are derived provides a simple mechanism to identify the outliers and establish statistical process control limits. A Monte Carlo simulation can be used to fit the data to a Normal curve.

If you would like a copy of the 'Profiler' program, please write me. You may use the program for your own purposes or post on your blog with credit. You may not use the program for commercial purposes. Write me at kozborn@sbcglobal.net.

Sunday, April 07, 2013

UC Berkeley Cherry Tree Project Dedication Ceremony - April 6, 2013

"A grove of graceful cherry trees has been planted as a tribute to graduates of Japanese ancestry, in honor of their contributions to society and in recognition of the educational excellence of the University of California."   Quoted from: Cherry Tree Project Plaque


Friday, January 18, 2013

Creating a Flickr Slide Show on Your Blog

Creating a Flickr Slide Show
(c) Ken Osborn 2013

Yes, you can post a Flickr slideshow on your blog site using a gadget, but what if you want a little more control?  For that I'm trying the slideshow generator called Flickr Slideshow Generator!  You can find it at http://fabiocavassini.com.ar/SlideShowGenerator.html.

You can make a slide show based on tags, like this one from my sets tagged 'Dickens.'


 To start the process you will need an NSID which is a unique number representing you on Flickr.
Entering Information to Access Flickr Images


 To find your id number use idGettr at http://idgettr.com/.
idGettr will Get Your Unique Flickr ID Number

After you get your ID you then enter either a set URL with or without tags or just tags.  If you enter just tags it will grab everything in your Flickr stream with the tag so don't get too crazy because if you are like me you may have a lot of images under some particular tag.  

Generating the Flickr Slideshow creates an HTML code you can cut and paste into your blog website.
HTML Code for Website


Sunday, January 13, 2013

Do You Really Need a Zoom Lens?

Do You Really Need a Zoom Lens
Ken Osborn (c) 2013

If you have a camera that can take a 25 MP (mega-pixel) image, you may have asked yourself "why do I need a zoom lens?"  If, like me, you aren't printing posters and mainly show your photos on your website, why not just use a good prime 50 mm lens?  Maybe a 70 mm if you are doing portraiture.   With a zoom you can compose the way you want in the field, but if you are going to resize the image prior to posting, what is the difference between doing that and cropping from a larger image?  After all, you have all those extra pixels does it really matter how you waste them: by reducing resolution or by cropping them away?

I decided the only way to answer that question was to try it.  

I used an 18-55 mm zoom lens on a Pentax K5IIS to take two photos.  The first at a zoom of 18 mm and the second at 55 mm.  


Image 1: 18 mm zoom
Image 2: 55 mm zoom
The 18 mm image was cropped to the focusing chart for an image size of 423 pixels wide.  The 55 mm image was cropped to the focusing chart and then resized to 423 pixels wide.  So now both images have the same target filling the view and are both at the same final resolution.  The results are immediately below with the 55 mm zoom photo on the left and the 18 mm photo on the right.  (Click on the image for a larger view.)

Comparing Resizing (left) vs Cropping (right)
  
I have concluded I will keep my telephoto!


Saturday, January 05, 2013

Restoring Old Comics and Memories


Restoring Old Comics and Memories
Ken Osborn © 2012

If you know Photoshop, like old comics, and would like to see what they looked like new, read on.   

I was and still am a big fan of Carl Barks duck stories: Donald Duck; his nephews Huey, Dewey, and Louie; Uncle Scrooge and a host of relatives.  Trying to refresh my memory on a Scrooge adventure I found an incredible resource, the Duck Comics Revue by Geoff Moses at http://duckcomicsrevue.blogspot.com/. 

Geoff’s blog is filled with all sorts of goodies including panels from some well remembered stories.  But after a few decades the print had faded.  Those old dime comics were printed on a cheaper paper and were not intended to last forever. 

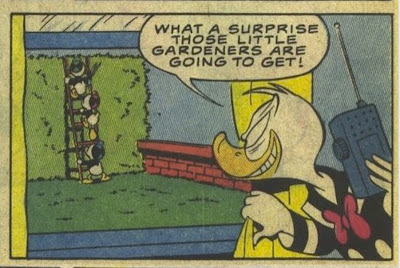
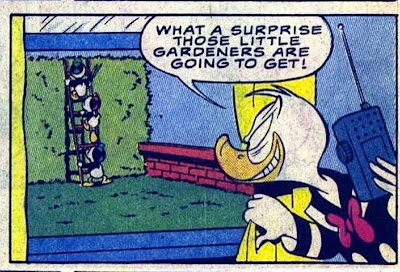
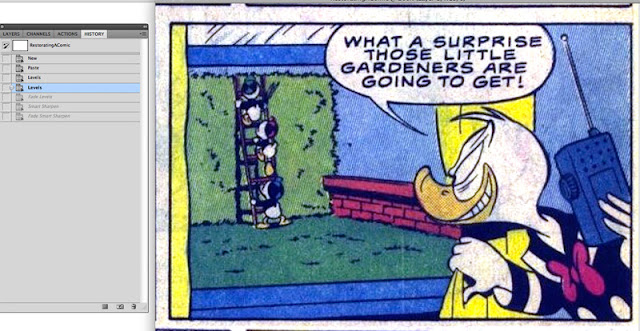
But with Photoshop it’s possible to restore these faded memories to their former glory.   Below are an original scan of a comic panel from the Duck Comics Revue followed by the restored version.

Faded Original
Restored Contrast and Colors
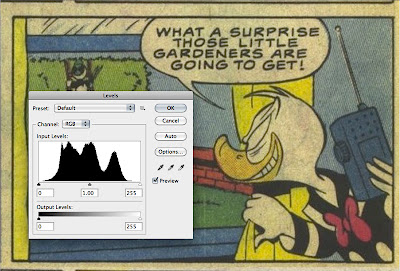
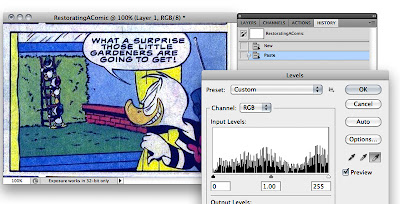
Starting with the scan, open it in Photoshop and take a look at the histogram. 

Histogram Using Photoshop Levels


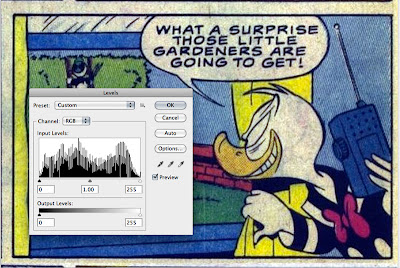
The histogram is not evenly spread across the full width with a space at the right (highlights) end consistent with the yellow faded appearance.  Mouse click the ‘Auto’ button to improve the contrast. 
Auto Adjust Levels

Notice that the histogram is now spread across the full width and the contrast has improved. But there is still a yellow cast.  To remove the yellow cast select the white ‘eye dropper’ (it’s the one on the right) and then use it to select an area of the panel border that is yellow but originally white.
Eye Dropper for Bright Whites

Maybe too white
  
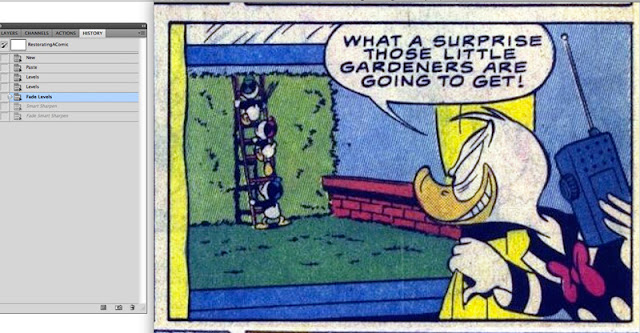
This is probably a bit harsh and the original was probably somewhere between bright white and faded yellow, so fade the levels about 50%.

Levels Faded 50%

Scanning the comic book will usually leave the print just a little soft, so a bit of sharpening may make the content a little more readable but it’s easy to overdo it so you may need to fade the sharpening.


 Sharpening a Little Harsh with Halos


Sharpening Faded


Before leaving the topic, here is one more example from a classic Donald Duck adventure, Trick or Treat (1952).

Original from Trick or Treat
Restored Version

And that’s it.  If you want to see a restored version of a 1950’s 3D Donald Duck giveaway, check it out at http://duckcomicsrevue.blogspot.com/2013/01/witch-hazel-remastered.html on Geoff Moses’ blog.