Soon to be developed in new residences for the City of Richmond, the greenhouses of the former rose and carnation nurseries remain for now. Once these greenhouses were some of the most productive on the West Coast, given the mild climate and extended growing season. Changes in tax law made imports cheaper and eventually led to the closure of these and other greenhouses in California and the U.S. Today this site in Richmond is one of the last remaining as a reminder of the past. Some of the structural reminders of that past will be allowed to remain as a link to our past and heritage.
Thursday, December 30, 2010
Wednesday, December 29, 2010
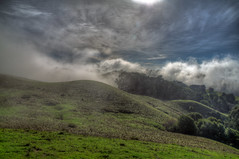
4734_5_6_7_8_Fog Shrouded Hills Of Wildcat Canyon
A break in the rain was an opportunity to capture that brief interlude when the morning mists roll over the hills. This view is from the San Pablo Ridge at the Richmond end looking south east. The site of the former Belgum Sanatorium is just visible at the lower right.
Friday, December 17, 2010
2010 Laboratory Christmas Potluck
Once again those hard working lab folks take time out for the annual Christmas potluck where hidden talents are expressed and green is the color of the day.
Sunday, September 12, 2010
Blossoms & Thorns: The Legacy of Richmond's Historic Japanese American Nurseries
Curated by: Emily Anderson & Donna Graves
2540 Barrett Ave
Richmond, CA 94804
Richmond, CA 94804
September 14th - November 13th
Reception:
September 25th 3:00 PM - 5:00 PM
September 25th 3:00 PM - 5:00 PM

Thursday, August 05, 2010
Growing Tomatoes in the Fog Zone
Before moving to the East Bay (Richmond, CA) I lived in Davis (CA) where the summers are hot and the tomatoes grow taller than giraffes (slight exaggeration). East Bay's summers are typically not hot and are sometimes confused for winter by those who do not live here. Tomatoes do not grow as tall as giraffes here. In fact it is difficult to get tomatoes to grow or at least grow tall and ripen, but I usually try anyway and somehow, this year, I got some surprises.
My first surprise was finding heirloom tomatoes at a local nursery (Spiral Gardens, 2830 Sacramento St. Berkeley). I first tasted heirloom tomatoes 2 years ago and found them tasty and satisfying. They seem to be catching on, and are available in the local 'organic' food stores. Getting them at a nursery as 1-gallon plants was unexpected and worth another growing effort.

My second surprise was that not only did these plants grow, but flourished! I planted five, three in one raised bed and two in another a few feet away. In one bed the plants exceed my height by 2-3 feet while in the other adjacent bed they do not come to my waist. The difference is due to fava beans, which I had planted in one of the beds as a green manure crop not expecting to plant anything else this season.

The purchase of the tomato plants was not planned and there was limited room in a bed where chard, parsley, and mints filled most of the small space. Figuring I would soon harvest the fava beans, I put three of the plants in with the beans and the other two with the chard et al. Two months later, and with the beans still not harvested, it became obvious there was no need to thin the beans as the tomatoes were decidedly not crowded but were exceeding even my UC Davis days expectations.

Fava beans are nitrogen fixers and tomato plants have need for lots of nitrogen to do well. The combination was working quite well. Of course, big plants does not equate to vine ripened tomatoes, but I do have a crop of tomatoes waiting for some warm weather to fully ripen. Come back in a month and see what happens.

Wednesday, June 23, 2010
Dew Not Confuse It With Guttation
Early morning and droplets of dew hang off the leave of plants - except this is not dew but water of gutattion. What's the difference? It sure looks like dew.

Let's take a closer look at one of these 'dew' drops.

Notice that the droplet is at the end of a leaf. Plants take water out of the soil and release it into the atmosphere as a vapor through openings in their leaves called stomata. This process is termed transpiration. Sometimes transpiration is inadequate to remove excess water and instead of vapor, droplets of mineral laden water are released through openings similar to the stomata. This process is termed guttation and it occurs mostly in the morning when the humidity is high. It also occurs if the plant has been recently watered.
These shots were taken early in the morning, but it's also possible I'm over watering my tomato plants! For more information on guttation and plant physiology see http://en.wikipedia.org/wiki/Xylem.
Tuesday, June 15, 2010
Classic Chemistry - The Way it Was in 1962

Fifty years ago electronic balances were the great new technological addition to analytical chemistry. The instructor for my quantitative analysis class did not inform his students that these were available until after we had been given the gratifying experience of using double pan balances requiring that we 'count the swings' for highly precise and accurate weighings. At the end of the second week we found out just how marvelous the new balances were but not until our notebooks had been filled with many pages of weighings. I still have that notebook and so will share a lab exercise.

The lessons learned from this exercise in 1962 remain with me as a way of conceptualizing the measurement process. All measurements can be represented numerically but also possess a physical reality. Counting the swings on a balance to estimate the last significant figure in the measurement gives a feel to the measurement process that a readout on a display cannot match.
The 3 minute video 'Classic Chemistry - The Way it Was' is based on the notebook entries for one afternoon in the Chemistry 131, Quantitative Analysis, laboratory in 1962. The sixteen pages of entries are mostly weighings with some calculations and notes. That was the way it was.
Friday, May 28, 2010
Misterken Retires from the Lab
After 33 years at EBMUD doing lab rat work, I have decided it's time to do something else. So I'll hang up the lab coat I seldom wore, sling camera bag over my shoulder, and see what awaits.
Lab staff, as usual, gave a nice sendoff complete with sugary treats, a plaque proving I really existed for 33 years, a finely tuned roast by a master roaster, and an accomplished photographer to capture the final moments. All-in-all a wonderful farewell.


I yielded and agreed to all ten reasons given for my departure with a margin of error of +/- 100%.
Finally - the Cake!

Lab staff, as usual, gave a nice sendoff complete with sugary treats, a plaque proving I really existed for 33 years, a finely tuned roast by a master roaster, and an accomplished photographer to capture the final moments. All-in-all a wonderful farewell.

I think there was hidden meaning in this...but I'm unable to detect what it is!

Two cakes! Plus a bowl of cherries! Auspicious.

Nirmela prepared a test of my knowledge of applied measurement theory.

Note that while the mouse is visible it cannot be weighed on these scales and therefore does not exist.
I passed the test.

Linnea shows her talents as a Roasting Toastmaster
I'm feeling a bit warm.

I yielded and agreed to all ten reasons given for my departure with a margin of error of +/- 100%.
Finally - the Cake!

Sunday, May 23, 2010
510Arts and the Ghost Roses Exhibit
It's official. 510Arts for the cities of Berkeley, Emeryville, Oakland, and Richmond has announced the annual Call for Submission to artists living in the 510 area code. If you are an artist living in the 510 area code, check it out.
And if that weren't enough - the announcement includes my photo The Boiler Room shot at the former Sakai Brother's Rose Nursery in Richmond
AND the highly acclaimed and anticipated Ghost Roses exhibit featuring fine art photography by Ellen Gailing, Matt Matsuoka, Fletcher Oakes, and me will open September 14 and run through Nov 13, 2010 at the Richmond Art Center in Richmond, CA.
Watch here for more details.

Thursday, May 20, 2010
By Popular Demand - High Dynamic Range Tutorial
This is a re-post of a popular tutorial on High Dynamic Range Photography, also called HDR. If HDR is new to you or you've heard of it but don't know exactly what it is or how to do it, watch this slide show.
High Dynamic Range Photography Explained - A Tutorial
High Dynamic Range Photography Explained - A Tutorial
Sunday, May 16, 2010
Ghost Roses

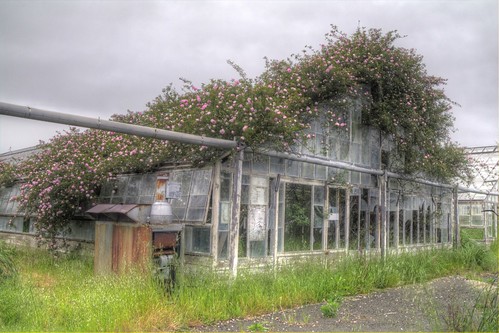
The nursery began in 1906 with a single greenhouse and grew to 40 greenhouses on 12 acres with the Sakai, Oishi, and Maida-Endo families. No longer in production, roses still flourish in the abandoned greenhouses. One greenhouse wears a cape of roses. The carnations fare less well having shallower roots that cannot reach the water table during the dry season.
Soon, this will be only a memory except for a portion that the City of Richmond plans to retain, something like Vision for Restoration, the panorama shown below.

In September 2010, through the efforts of Susan Sharfman, Michele Seville, and Emily Anderson, an exhibit including my work and that of three other photographers will be on display together with an historical context provided by the National Park Service, the Cities of Richmond and El Cerrito, and Donna Graves an historian who has authored the report Historic Architectural Evaluation of the Sakai, Oishi, and Maida-Endo Nurseries of Richmond, CA available at www.ci.richmond.ca.us/DocumentView.aspx?DID=2144.
More information will be available as plans for this exhibit are still in progress.
Friday, May 14, 2010
A Dijemeric Tutorial - Printing At Costco
Back by popular demand, my Tutorial on Printing at Costco explains how to send your digital images to Costco and use of a profile to get the best results.

Wednesday, May 12, 2010
Strategies for Sampling in a Potato Warehouse
You rent a warehouse in the Mission District of San Francisco for the purpose of storing potatoes. The storage space is not big with barely enough capacity to hold 5 tons, or 10,000 pounds of potatoes. The owner of the warehouse is concerned that you might try and exceed that quantity and has placed a penalty clause in the contract if you do. He also requires an annual inventory of the quantity of potatoes you are storing.
You hire a high school student to weigh potatoes so you can determine how much is in a warehouse. To estimate the weight of potatoes in the warehouse without paying the student to weigh each and every potato you've decided that you will have him make no more than 100 weighings, randomly selected. Once the potatoes are sampled and weighed you will estimate the total weight by multiplying the average weight per gallon of potatoes times the total volume of potatoes in gallons in the warehouse (you know this because you have a calculator and are good at math).
To do this weighing, would it be better to have the student weigh lots of individual potatoes one at a time or weigh composites of several potatoes at a time in fewer collections of a gallon each? And should you caution the student to take care in weighing? Does it matter if you are just a little bit over the 10,000 pounds? Will the weighings more likely show you are over if the weighings are precise?
The answers may not be immediately obvious and depend on at least three variables: 1) the precision of the student in taking the weights and volumes, 2) the difference between the actual 'true' weight of potatoes in the warehouse and the penalty threshold, and 3) whether the actual weight is above or below the threshold. To test how these three variables can affect the outcome, I have developed A Monte Carlo Model for Sampling Potatoes or Anything Else. Try it for yourself.

Enter the measurement precision (also known as percent relative standard deviation or %RSD) in cell B3, the potato penalty threshold in cell B4, and the expected true weight of potatoes in cell B5. The outputs are in cells D7 (percentage hits exceeding the penalty threshold for weights of single potatoes) and E7 (percentage hits for collections of potatoes).
The small chart displays overall statistics of average, standard deviation (a measure of variability), RSD (a measure of precision), and number of Hits (number of times the given sampling method exceeds the penalty threshold). In the example shown here, the averages for both methods exceed 10,000 pounds and the number of hits are 4800 for the single potato approach and 5500 for the collection of potato approach. The true value was set at 10,000 and precision at 50% (i.e., sloppy technique) for the default settings.
The long chart displays the first ten samplings of the student under the two different sampling methods and can be used as a check to track his performance.
Try entering different values for RSD, threshold, and true weight and see what you get. For example, if the student is sloppy does it make any difference if the threshold is above or below the true value? If the student is very precise can you get closer to the threshold without a penalty? And don't be timid about the actual weight of potatoes. You might try putting in more than 10,000 pounds and see if you can avoid the penalty!
You hire a high school student to weigh potatoes so you can determine how much is in a warehouse. To estimate the weight of potatoes in the warehouse without paying the student to weigh each and every potato you've decided that you will have him make no more than 100 weighings, randomly selected. Once the potatoes are sampled and weighed you will estimate the total weight by multiplying the average weight per gallon of potatoes times the total volume of potatoes in gallons in the warehouse (you know this because you have a calculator and are good at math).
To do this weighing, would it be better to have the student weigh lots of individual potatoes one at a time or weigh composites of several potatoes at a time in fewer collections of a gallon each? And should you caution the student to take care in weighing? Does it matter if you are just a little bit over the 10,000 pounds? Will the weighings more likely show you are over if the weighings are precise?
The answers may not be immediately obvious and depend on at least three variables: 1) the precision of the student in taking the weights and volumes, 2) the difference between the actual 'true' weight of potatoes in the warehouse and the penalty threshold, and 3) whether the actual weight is above or below the threshold. To test how these three variables can affect the outcome, I have developed A Monte Carlo Model for Sampling Potatoes or Anything Else. Try it for yourself.

Enter the measurement precision (also known as percent relative standard deviation or %RSD) in cell B3, the potato penalty threshold in cell B4, and the expected true weight of potatoes in cell B5. The outputs are in cells D7 (percentage hits exceeding the penalty threshold for weights of single potatoes) and E7 (percentage hits for collections of potatoes).
The small chart displays overall statistics of average, standard deviation (a measure of variability), RSD (a measure of precision), and number of Hits (number of times the given sampling method exceeds the penalty threshold). In the example shown here, the averages for both methods exceed 10,000 pounds and the number of hits are 4800 for the single potato approach and 5500 for the collection of potato approach. The true value was set at 10,000 and precision at 50% (i.e., sloppy technique) for the default settings.
Try entering different values for RSD, threshold, and true weight and see what you get. For example, if the student is sloppy does it make any difference if the threshold is above or below the true value? If the student is very precise can you get closer to the threshold without a penalty? And don't be timid about the actual weight of potatoes. You might try putting in more than 10,000 pounds and see if you can avoid the penalty!
Tuesday, May 04, 2010
The Drunkard's Walk
Random events can be misleading. Flip a coin. It has a 50% chance of landing heads and 50% tails. Now suppose it has landed heads 10 times in a row. What are the chances it will land heads up on the next toss? If it is truly an unbiased coin, the odds for a heads up will be 50%. Past events have no effect on future events. But what are the odds that a coin will land heads up ten times in a row?
The chart below shows a plot generated from a random number generation program, Drunkard's Walk. Try running the program Drunkard's Walk yourself and see what kind of trends you can generate from a random process. Enter any number in cell B8 (Count). Press return. Each plotted point is the sum of the previous plotted point plus the random assignment of a one or a minus one. Are there trends? Does it always look random?

The chart below shows a plot generated from a random number generation program, Drunkard's Walk. Try running the program Drunkard's Walk yourself and see what kind of trends you can generate from a random process. Enter any number in cell B8 (Count). Press return. Each plotted point is the sum of the previous plotted point plus the random assignment of a one or a minus one. Are there trends? Does it always look random?

Monday, May 03, 2010
Twenty Seven Years of Rainfall Records
Rainfall records on a home rain gauge measuring the rainfall in Richmond CA on the Wildcat Canyon ridge since 1982.
Rainfall Records by Year

Rainfall Records by Year

Sunday, May 02, 2010
Dijemry for March 2010
Somehow March got skipped, so for April I'll start with the Berkeley Camera Club's March field trip to the Delta and towns of Locke, Walnut Grove, Isleton, and Rio Vista. First stop, Al the Wop's http://www.flickr.com/photos/misterken/sets/72157623622909576/

http://www.flickr.com/photos/misterken/sets/72157623489006367/ and http://www.flickr.com/photos/misterken/sets/72157623785171217/.

And while on the subject of roses, stay tuned for an exhibit coming up in September. It's still in the planning stages, but when I have more information like dates and location, I'll be sure and let you know.
We've had some nice wet days recently and incredible skies. Just the kind of atmospherics photographers like, which you can see why in SD1 Views on a Cloudy Day at Lunchtime http://www.flickr.com/photos/misterken/sets/72157623579527657/

And with rains come wildflowers. I drove to Mount Diablo a bit early for the big blooms, but was not disappointed with what was flowering. See some wildflowers, barns, and the car I drove at http://www.flickr.com/photos/misterken/sets/72157623722059750/

I'm sure May will bring even more wildflowers, so until then
Keep the light focused.
Documenting with Video - Controlling Invasive Species
At the risk of alienating the few loyal visitors Dijemeric Visualizations, where math meets photography, the next few postings will be of a gardening topic using videos shot with a Pentax K7 DSLR. My backyard hosts a number of oak and bay trees along with an understory of native plants such as Sword Ferns, Trillium spp, wild rose, Yerba Buena mint, and others I have not yet identified. There are also invasive weedy species which if allowed to grow eventually dominate and displace the natives.
All plants, native or invasive, have growth and reproductive strategies. The secret in bringing the invasive plants under control is to take advantage of the differences in those strategies. The immediate subject is Witchgrass. It is an annual that grows to a height of about two feet prior to setting seeds. The strategy is to cut the Witchgrass at a height low enough to remove the seed heads before they ripen but low enough to leave the shorter native plants, such as the Trilliums.
All plants, native or invasive, have growth and reproductive strategies. The secret in bringing the invasive plants under control is to take advantage of the differences in those strategies. The immediate subject is Witchgrass. It is an annual that grows to a height of about two feet prior to setting seeds. The strategy is to cut the Witchgrass at a height low enough to remove the seed heads before they ripen but low enough to leave the shorter native plants, such as the Trilliums.
Sunday, April 11, 2010
Digital Noise and Photography
The Problem
Noise is not only a problem for getting good analytical results in the laboratory, but is an issue for the photographer. In my previous three blogs I presented a theoretical basis for dealing with analytical noise that applies to any measurement process including photography. For the photographer, digital noise is most bothersome in the shadow details. This is because there is less digital information in the shadows than the mid-tones and highlights. Less light means fewer photons, fewer photons mean fewer pixels, and fewer pixels is less digital information. Increasing the sensitivity to boost the signal for low light does not solve the problem, it just increases the noise.
[If you missed the earlier blogs that covered basic theory, don't panic. You can still read them starting with What is Detection and What Does it Mean for Photography. ]
An Approach from the Lab
In earlier blogs I have noted that while an individual measurement near the detection limit has limited value because of the large associated error (i.e., noise is large relative to the measurement), in the context of a data set a collection of measurements has statistical utility even when all of the measurements are near or even below detection. That is because the errors, which are random in nature, average out. The same is true in photography. Consider that each pixel in your image is the consequence of photons striking the sensor. But sometimes the sensor will create more than one pixel for an in-coming photon and sometimes it will create no pixels for in-coming photons. This is a random process, meaning that sometimes the effect will be positive and sometimes negative. If you can average enough random events in a series of nearly identical events, the random noise will be averaged out and canceled.
An Example
Consider the following photograph titled It's Really Very Underexposed! The only visible detail is in the sky, where the highlights are. For this shot near sundown, I exposed it so that the highlights in the sky would not be blown and set the f/stop to maximize depth-of-field. (Note a double-click on any of the images will open it at a larger resolution.)

The problem is that the shadow areas have dramatically less light than the sky and so are totally blocked up (i.e., very few photons). We might conclude that there is nothing of value in the shadows, but to make sure I applied a curves adjustment to get Curves Adjusted to Open Shadows.


So how do you get rid of the noise?
Noise is not only a problem for getting good analytical results in the laboratory, but is an issue for the photographer. In my previous three blogs I presented a theoretical basis for dealing with analytical noise that applies to any measurement process including photography. For the photographer, digital noise is most bothersome in the shadow details. This is because there is less digital information in the shadows than the mid-tones and highlights. Less light means fewer photons, fewer photons mean fewer pixels, and fewer pixels is less digital information. Increasing the sensitivity to boost the signal for low light does not solve the problem, it just increases the noise.
[If you missed the earlier blogs that covered basic theory, don't panic. You can still read them starting with What is Detection and What Does it Mean for Photography. ]
An Approach from the Lab
In earlier blogs I have noted that while an individual measurement near the detection limit has limited value because of the large associated error (i.e., noise is large relative to the measurement), in the context of a data set a collection of measurements has statistical utility even when all of the measurements are near or even below detection. That is because the errors, which are random in nature, average out. The same is true in photography. Consider that each pixel in your image is the consequence of photons striking the sensor. But sometimes the sensor will create more than one pixel for an in-coming photon and sometimes it will create no pixels for in-coming photons. This is a random process, meaning that sometimes the effect will be positive and sometimes negative. If you can average enough random events in a series of nearly identical events, the random noise will be averaged out and canceled.
An Example
Consider the following photograph titled It's Really Very Underexposed! The only visible detail is in the sky, where the highlights are. For this shot near sundown, I exposed it so that the highlights in the sky would not be blown and set the f/stop to maximize depth-of-field. (Note a double-click on any of the images will open it at a larger resolution.)

It's Really Very Underexposed!

Curves Adjusted to Open Shadows
So now it should be obvious that there was light in the shadow areas, but not very much. As a consequence, just like measurements in the lab, when the measurement is near the limit of detection, there is a lot of noise that makes accurate results difficult - but not impossible. See the next image as a crop of the one above to convince yourself that there is a lot of noise in this version (mouse-click the image for a larger more viewable version).

Crop of Curves Adjusted to Open Shadows
So how do you get rid of the noise?
Thursday, April 08, 2010
Calculating Detection Limits - Some Math Required
See Detection What is it and What Does it Mean for Photography for an introduction and Detection in the Testing Laboratory for a discussion of the concepts of detection, quantification, false positives, and false negatives.

Detection Concepts Chart: The blue curve is a distribution of measurements on a sample with nothing in it (a very clean blank). The red horizontal line represents the detection level. Only 1% of the measurements of an uncontaminated blank will exceed the detection level. The 1% level protects against false positives 99% of the time. The orange line represents a level that should be detected all of the time if the detection level is truly achievable. It protects against false negatives.
MDL Defined by Code
The standard for the calculation of detection limits (MDLs) is the US EPA Code of Federal Regulations (40 CFR 136). MDLs are calculated from the variance of the replicate analysis of either a ultra-clean sample (blank) or a quality control sample made from a blank by adding the substance(s) of interest at a level above but near detection. Replicates can be analyzed either in a single batch (usually with 7 replicates) or over time (with 20 or more replicates). If the former approach is used, the calculated detection limit ignores the contribution of errors of time-variance. While both approaches are allowed, there are differences in the results. Single-batch limits tend to be less than comparable time-variance determined limits. Some, but not all, laboratories, include one or more low level quality control samples in each day's batch for the purpose of controlling against false negatives and to generate a data base for the calculation of detection limits and/or confirmation of detection capability.
Problems with the Traditional Approach and a Robust Alternative
The analysis of seven replicates in a single batch generates a detection limit that is artificially low and not achievable on a routine basis. The MDL as does not account for false negatives: an analytical result below detection has a 50% chance of being a false negative. Performing a single batch detection limit study requires reassigning staff out of the routine production stream. The aperiodic approach to confirming detection limit capability on a more-or-less annual basis sidelines detection limits from the routine batch based Quality Control. By adding a routine QC sample to the analytical stream, it is possible to avoid these problems and develop detection limits that are robust, achievable on a routine basis, account for false negatives, and do not require to reassign staff off of production.
False Negatives
The inability to detect an analyte at two to three times the stated detection limit indicates a false negative. Such a failure may be due to chemical interference, instrument malfunction, or analyst error. In addition to a determination that the LCS is routinely detectable with each preparatory batch, accuracy is calculated and reported as an indicator of agreement between the known (i.e., true) and measured concentrations on an on-going basis and is used to generate control charts for LCS results.
Tuesday, April 06, 2010
Detection and Quantification in the Testing Laboratory

For a previous discussion on the meaning of detection and quantification see Detection - What is it and What Does it Mean for Photography?.
Your Drinking Water
A drinking water laboratory tests water samples to determine what is in them. The ultimate objective is to ensure the safety and reliability of drinking water supplies. But every analytical measurement has error. To control error, laboratories must include check samples to distinguish the known from the unknown. Sometimes the quantity of a substance is too low for the method to distinguish from a sample with nothing in it (a blank). The lowest threshold at which a method can determine the presence of a substance versus its absence is called the detection limit. In other words, detection occurs when a test method confirms the presence of a substance (analyte).
Detection and Quantification
A method detection limit (aka MDL in United States and Lc in most other countries) represents the detection capability of a method including all analytical and preparatory steps. While meaningful in a statistical context, an analytical result at or slightly above detection is not quantified and by itself cannot generally be used to make decisions about the quantity of analyte present in the analyzed sample other than the fact that it is present. The IUPAC (International Union of Pure and Applied Chemistry) term for detection is the Critical Value (Lc).
Quantification is when the method establishes that the amount of the substance is sufficiently large that noise is a small fraction enabling scientific, legal, and process decisions. A quantified result is one that can be assigned a number with a known precision and accuracy while a detected result is one where it is only possible to state that a substance exists at some quantity above zero but the exact number cannot be known.
A quantified result is one with an acceptably low error so that a decision can be made about the quantity of analyte. Reporting Limit (RL), Minimum Level (ML), Detection Limit for Reporting (DLR), FNQS (False Negative Quality Control Sample), and Practical Quantitation Limit (PQL) are some of the terms used to describe the minimum concentration necessary to make a quantified decsion. The IUPAC term for quantification is the Limit of Quantification (Lq). Another term, Limit of Detection (LOD) is an IUPAC quantity between the Lc and Lq that minimizes false negatives.
Measurement Error and False Decisions
All analytical results include measurement error so that any result has a specified probability of being either falsely positive or falsely negative. An substance detected when it is not present is a false positive; a substance not detected when it is present is a false negative. The detection limit (MDL/Lc) is a statistic that is defined to limit the odds of a false positive to 1% while a quantification limit (FNQS, ML, DLR, Lq) is generally defined to limit the odds of a false negative to 5%. Thus a measurement that barely exceeds the MDL could be in error 1 time out of 100 and a measurement that is non-detect at the quantification level could be in error 5 times out of 100. In the former case, the the analyzed substance would be falsely concluded as being present and in the latter it would be falsely concluded as being absent.
Next
In my next blog, I'll show how to calculate detection limits in a way that avoids taking staff out of routine production.
Sunday, April 04, 2010
What is Detection? What's it Mean for Photography?

Noise, Observations, Detection
Noise in our daily observations, in analytical measurements, and in photography obscures informational content. That information can be in a conversation, a test result on a water sample, or detail in a photograph. Whether we can extract information from a measurement or observation depends upon the sensitivity and selectivity of the measurement method otherwise known as detection and quantitation capabilities. In this series on detection and quantitation, post 1 will introduce the concepts, post 2 will demonstrate the use of detection and quantitation in a laboratory setting, and post 3 will develop the mathematical concepts. Posts 4-6 will provide examples as applied to photography.
Detection and Quantitation in an Everyday Experience
Let me start with an example based on this scene from the bazaar in Cairo. As the two women walk through the gate, the woman to the right turns and asks her friend about the wares of the merchant ahead of them. The other woman knows her friend is talking to her but cannot hear her above the crowd so asks her to speak up. She can now hear her friend but cannot understand her words. This is detection. An observation or measurement distinguishable from the noise is a detection. She asks her to speak up some more and finally can hear her words and understands her question. This is quantification; an observation or measurement sufficiently different from the noise to allow decisions to be made.
In the next two blogs I will discuss more of the theoretical concepts before presenting some applications to photography. I hope to show how the concepts of detection and quantitation relate to photography and are the theoretical basis for dealing with digital noise, optimization of shadow details, and building models to distinguish unaltered vs modified digital images.
The Promise for Photography
Here's the proposal: a photograph with maximum DOF (i.e., minimum aperture), great shadow detail, shot in low light, at low ISO, and exposed for the low end of the highlights (zone 8). Using the theories on digital noise and detection, I will show you how it can be done.
Next
Detection in the Testing Laboratory for a discussion of detection and quantitation concepts in the testing laboratory and how laboratories can check to ensure that the test results are valid.
Footnote
For those curious about the photo. It is a composite of five photographs all taken within a one hour period in the Cairo souk (market place). Western elements in the main image were replaced with more traditional subjects: two men in jeans walking under the arch were replaced with the two women; the apartments in the background were replaced with a scene from a nearby street; the women talking to the merchant were from a nearby street talking to another merchant and replaced a group of tourists. The turbaned merchant and man entering from the right are as they appeared in the primary photo.
Tuesday, March 23, 2010
Twenty Random Points Resolved
What is Random?
Random to many means 'chaotic and without structure' but random has pattern, predictability, and order. Flip a coin 100 times. Before you do that, see if you can predict the number of heads. You will probably predict 50 and it may or may not be correct. You should be close, however. How close? That's a matter of statistics and why I say random events are ordered events and are predictable. I would predict on a toss of an unbiased coin, one you haven't shaved or weighted, that it will come up heads 40 to 60 times and if you were to repeat the 100 tosses 1000 times, more than 90% of the tosses would be 40 to 60 heads.
Thursday, March 18, 2010

Tuesday, March 02, 2010
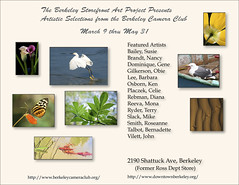
BCC Storefront Art Exhibit
The Berkeley Camera Club together with the Berkeley Storefront Art Project presents a selection of work from its members.
On display in the former Ross Department Store at 2190 Shattuck, Berkeley starting March 9, 2010.
On display in the former Ross Department Store at 2190 Shattuck, Berkeley starting March 9, 2010.
Friday, February 19, 2010
Of Gardening and Mice


Spring is the time for wildflowers, planting the vegetable garden, and mice.
Hoping to get an early start on this year's garden, I bought some starts for peas, lettuce, spinach, and artichokes. There are three raised beds with one sprouting chard and parsley from last year, another with a nitrogen-fixing bean nearing harvest, and an empty bed readied for the starts. The garden tools are kept nearby in a converted horse stable with garden gloves in a mouse-proof cupboard. This proved convenient not just for me but also a mother mouse who discovered the cupboard wasn't mouse proof and contained most excellent material for a nest: my gloves.
On opening the cupboard a gray object moves rapidly from behind a box and backs into a corner - with two baby mice still not fully disengaged from mom; she is in the process of giving birth. I changed my plans and ran for camera and surgical gloves. Momma was still hugging the corner when I returned and I was able to take a few shots before she ran and disappeared behind another box. A minute later she reappeared sans babies, scampered up the inside of the cupboard, and out through a very small hole. I then removed the box and ... no babies! I removed every item in the cupboard and looked at the bottom and sides of each object removed... no babies.
It is a mystery to me. I can only presume she was either able to reverse the birthing process or (gasp!), she ate them.
Monday, January 25, 2010
Red Bubble T-Shirts
A little self promotion: I've put some photos on Red Bubble that work with T-shirts.
Subscribe to:
Comments (Atom)


